Last year I wrote a blog on ‘what we know and what we don’t’ about the links between stop and search and knife crime in London. At that time, there were signs that knife crime was increasing after a period of falls, and a number of commentators connected that to the very large reduction seen in the use of stop and search by around three quarters from a peak in 2011.
In October 2015, Theresa May, then Home Secretary, used a speech to the National Black Police Association to refute any link between falls in the use of stop and search and rising knife crime, stating:
“…when you look at the evidence, when you look at places like London where stop and searches have fallen the most, you see that in fact that reduction has nothing to do with knife crime. In London, so-called blade or point stops where officers suspect the individual is carrying a knife accounted for less than one per cent of the reduction in stops and searches by the Metropolitan Police in the last year.
“The greatest reductions in London have actually been in stop and searches related to drugs and stolen property, of which there were 77,000 fewer this year four-fifths of the total fall in stops and searches. So it is simply not true that knife crime is rising because the police are no longer stopping and searching those carrying knives.”
This year there has been a very sharp increase in knife crime (and gun crime) in London, although the peak in August was still below those seen in the period from 2008 to 2011 (when rates of stop and search were three to four times higher).
To view in full-scale, click on the image below.

According to a well-placed source in the Metropolitan Police Service (MPS), I am told there is no evidence for any changes to crime recording practice that might account for this recent increase. The concurrent rise in knife and gun crime – the latter even more marked in percentage terms – would seem to suggest the possibility of some kind of wider social phenomenon, and I am told there is some evidence of rising violence in the middle market of the drugs economy. But what about the role of stop and search?
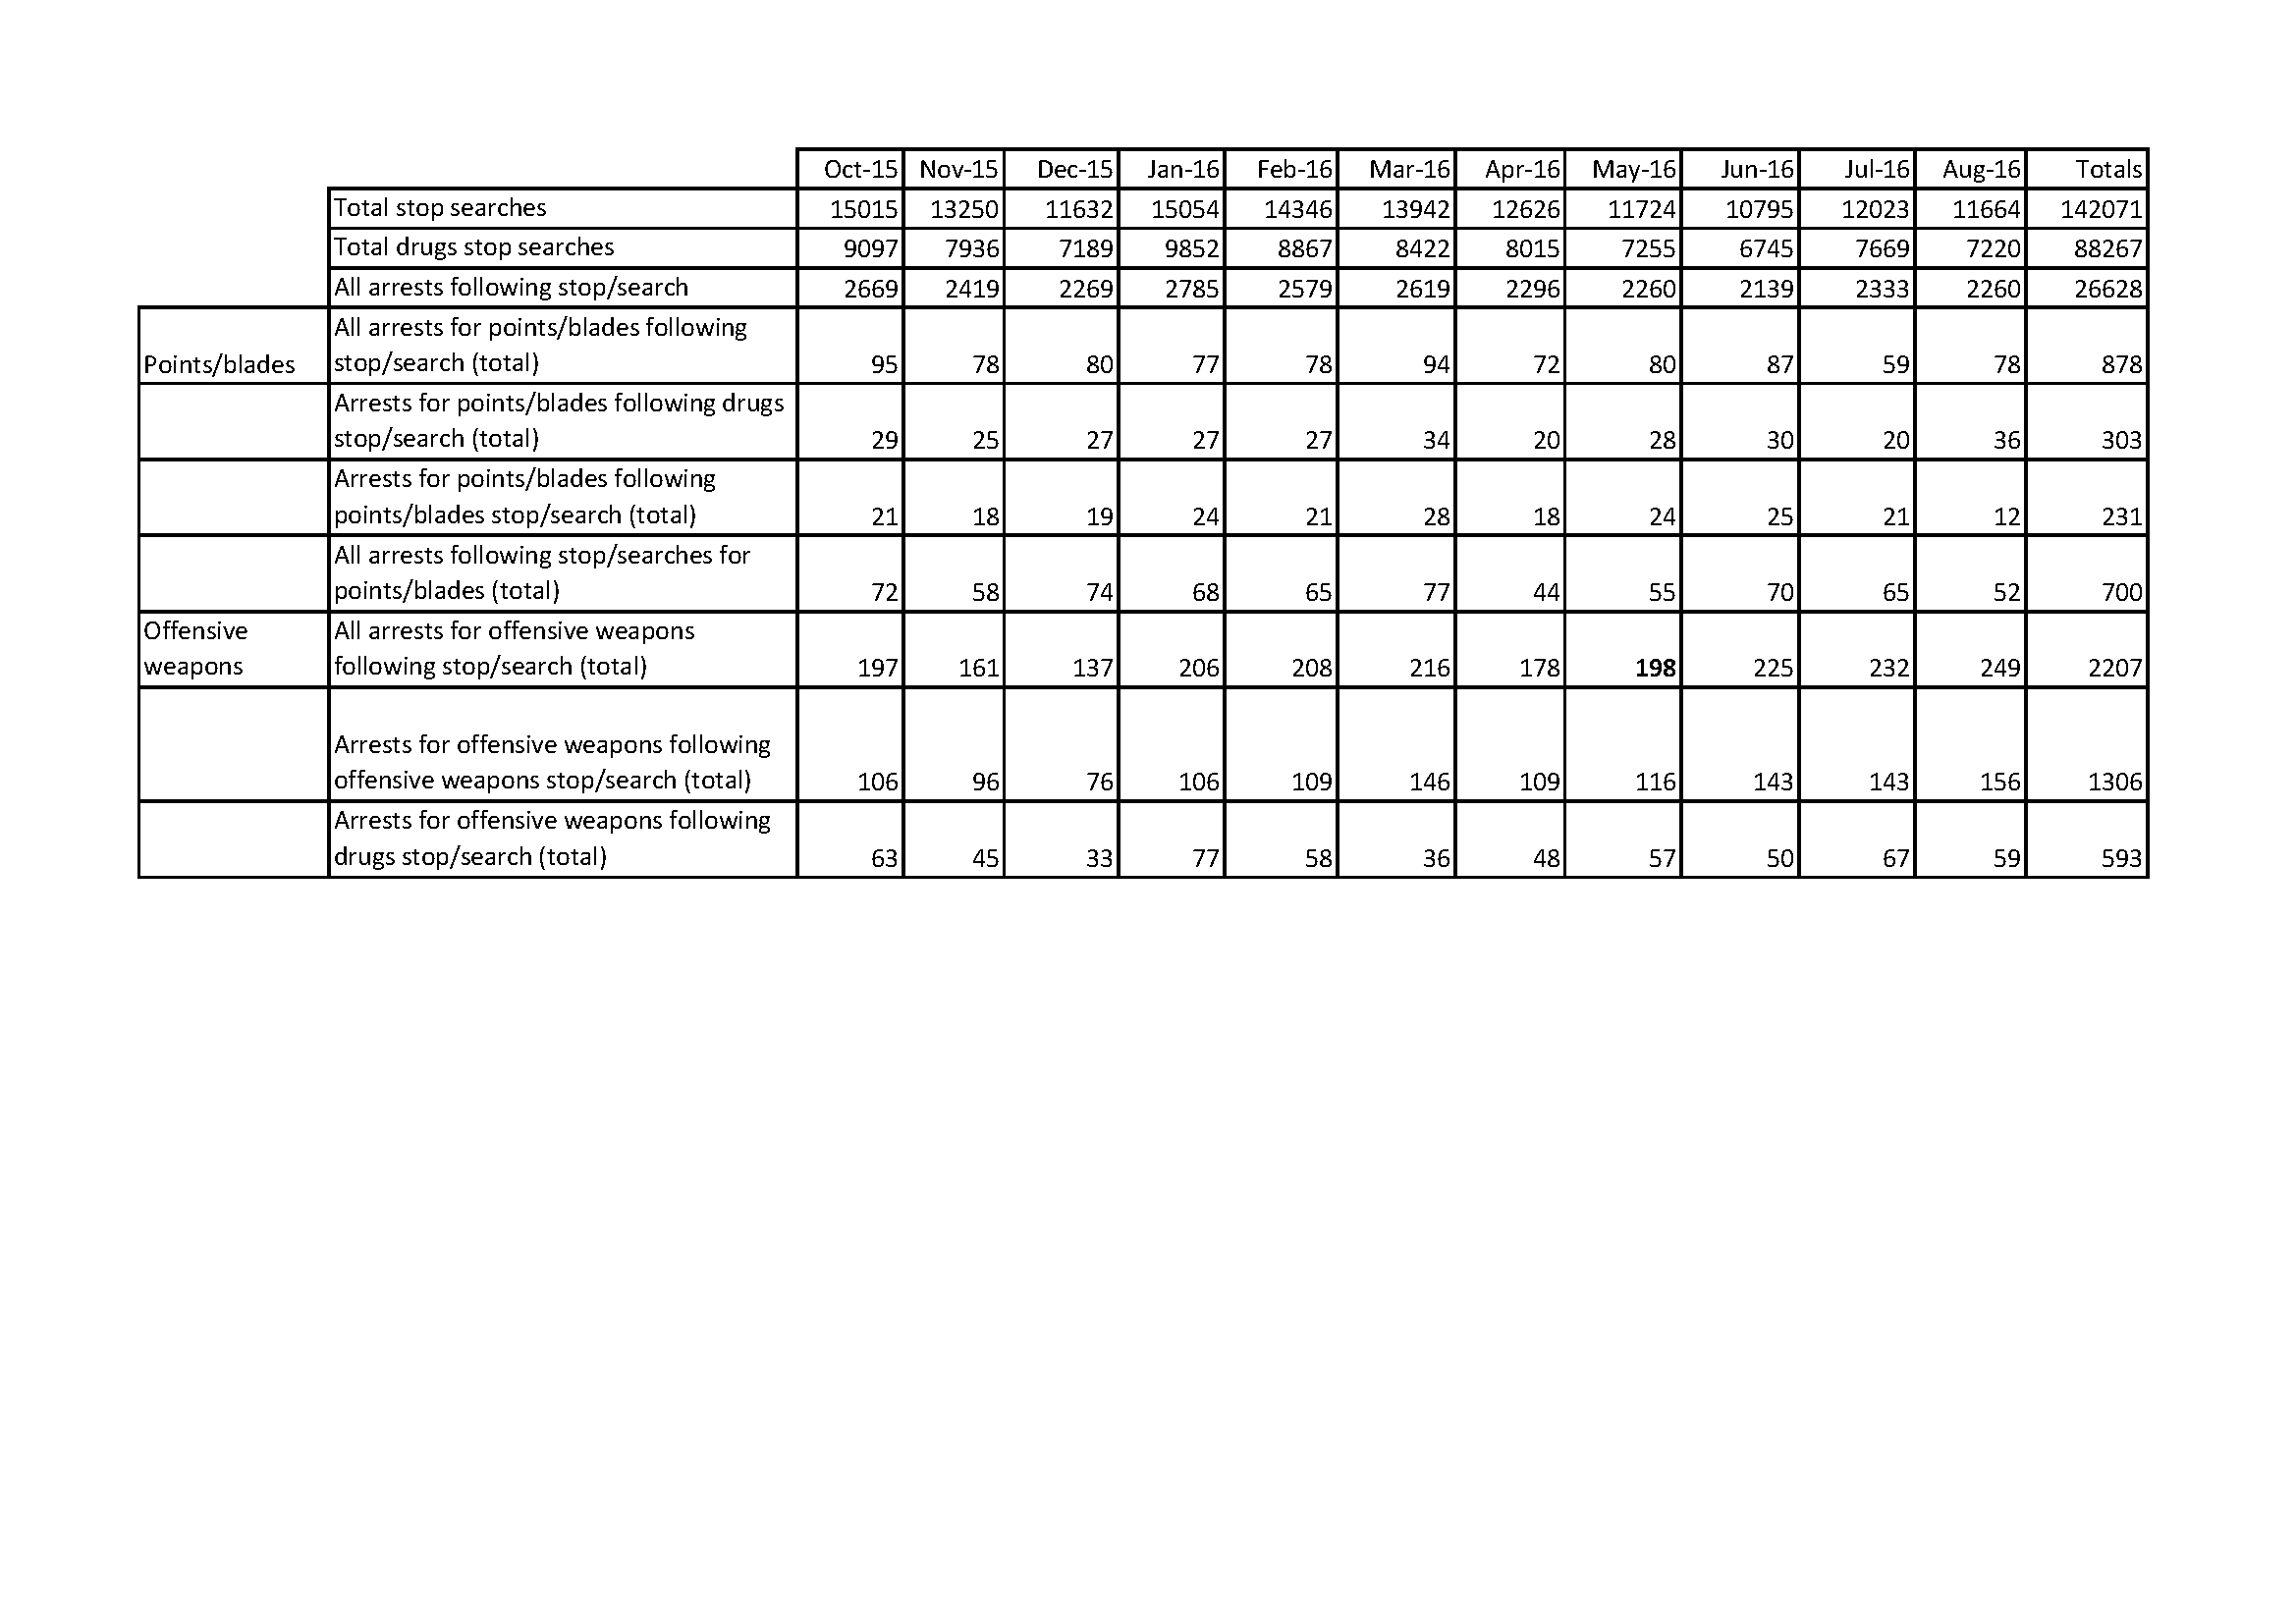
Last week I happened across the most recently published MPS-wide ‘Stop and Search Monitoring Reports’ (the reports for July and August 2016 are available here at the time of writing), and saw that they include data on the relationship between the reasons for stops and searches and the reasons for subsequent arrests. I was then able to obtain some of the previously published monthly reports from the MPS, giving me 11 months of data covering the period from October 2015 to August 2016. During this time there were 142,071 stops and searches at an average of 12,916 per month.
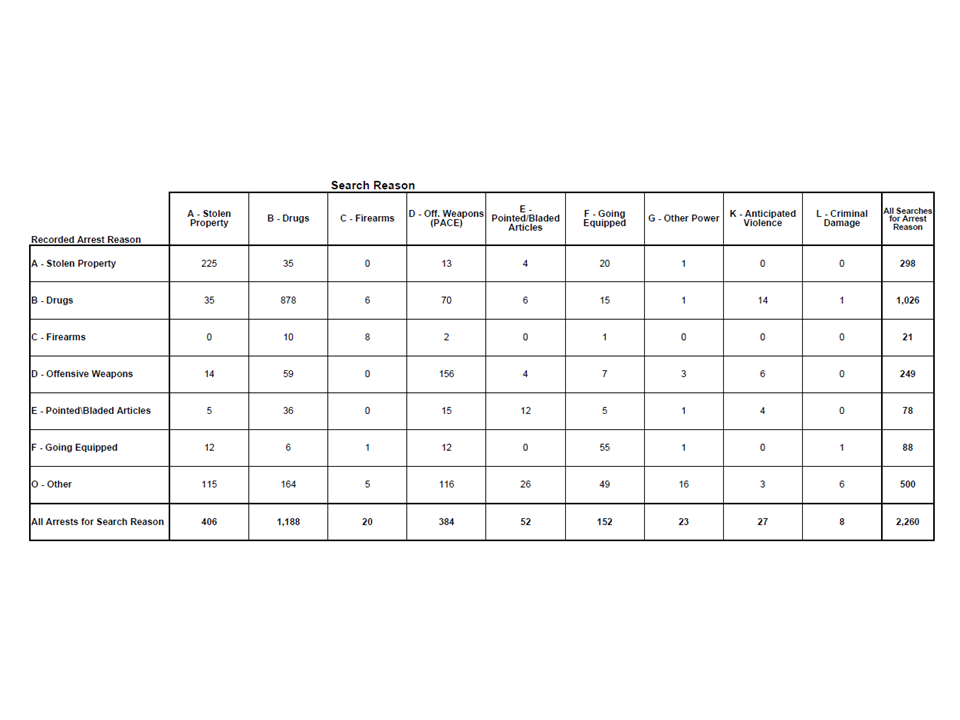
Here is the table for August 2016 (from page 16 of the report). To view in full-scale, click on image below.
Points and blades
Theresa May’s speech focused on stops and searches for ‘points and blades’. For August 2016 we can see that there were in total 2,260 arrests resulting from 11,664 stops and searches an arrest rate of 19.4 per cent. Of these arrests, 52 resulted from a stop and search for pointed/bladed articles’, although only 12 of these arrests were actually for points/blades. Overall there were 78 arrests for points/blades, of which 36 (that is 46.2 per cent) resulted from drugs searches.
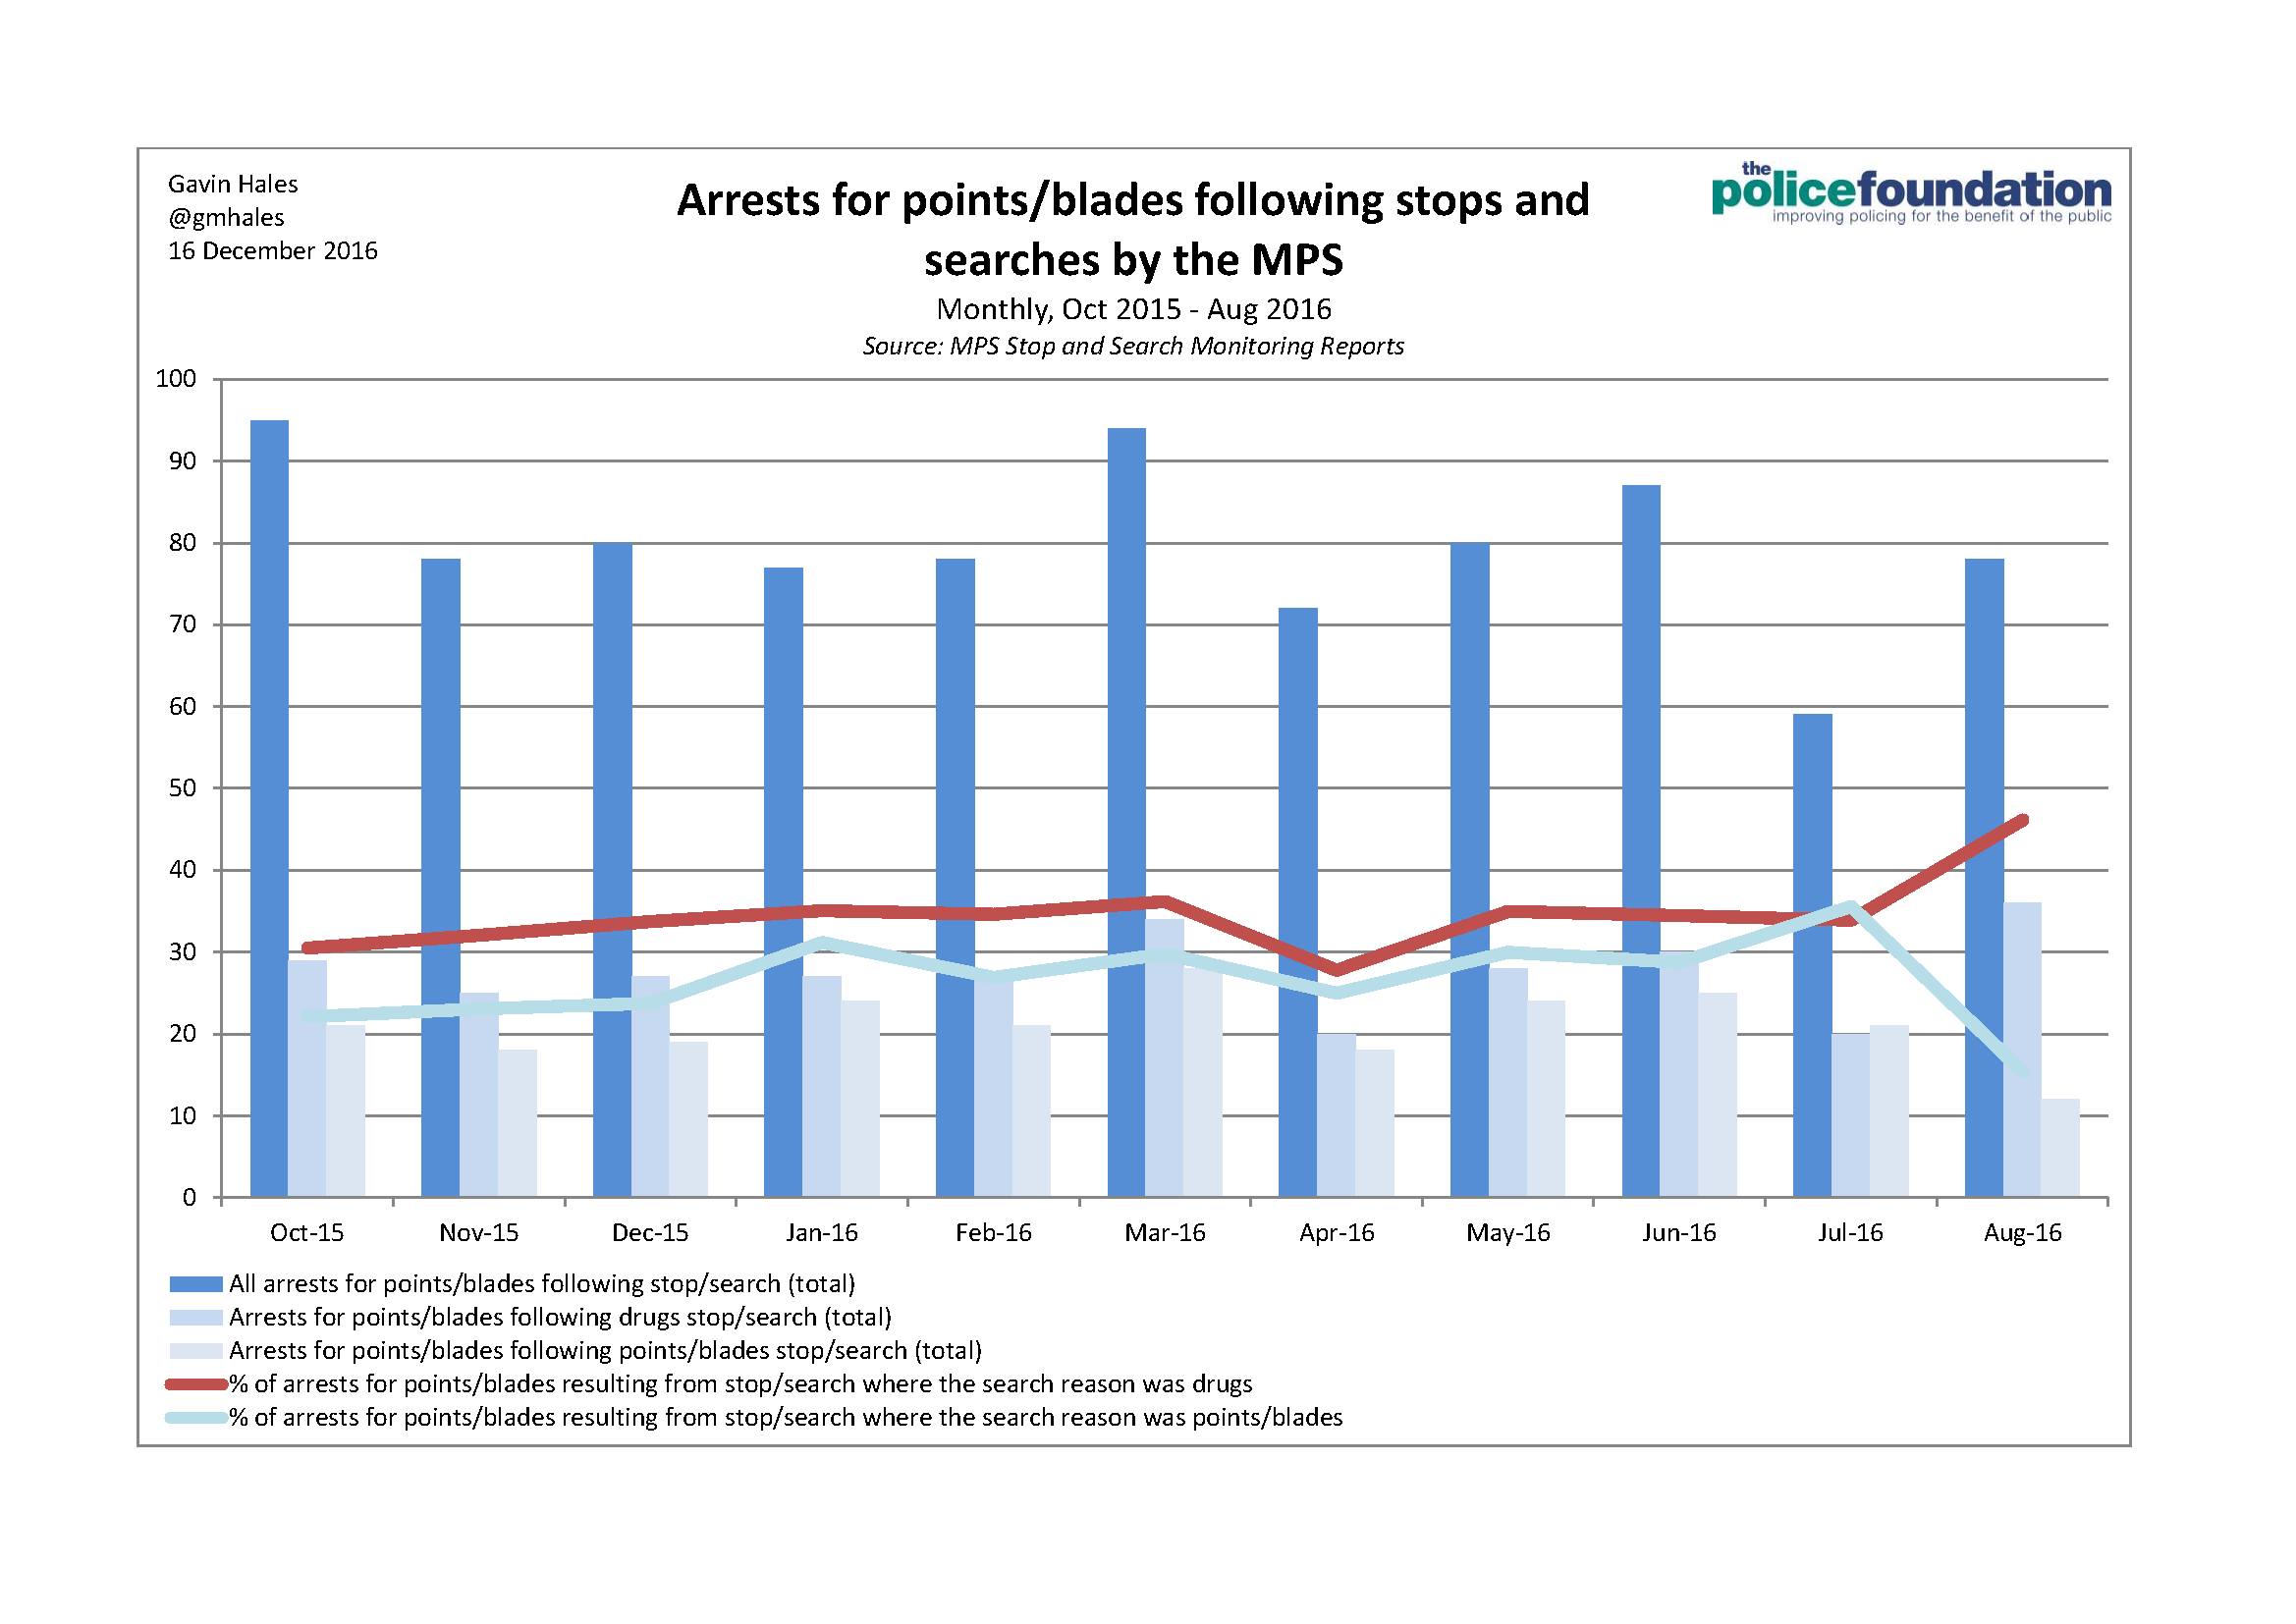
“Over the longer period from October 2015 to August 2016, 34.5 per cent of arrests for points/blades resulted from drugs stops and searches (303 from a total of 878), while only 26.3 per cent (231 out of 878) resulted from points/blades stops and searches.
To view chart in full-scale, click on the image below:
Of course, knives will have been seized during stops and searches other than where the main reason for arrest was points and blades, for example where the principle reason for arrest was other more serious offences for example robbery, which would be recorded as ‘other’ arrests in the table above. Other knives will have been found during post-arrest searches. Unfortunately, these knives aren’t visible in published data.
Offensive weapons
Although overlooked in Theresa May’s speech, many knives are recorded as ‘offensive weapons’, a problematic category that encompasses “articles made or adapted for use to causing (sic) injury to the person, or intended by the person having it with him for such use” (emphasis added). This covers a wide range of ‘articles’, including those that are clearly not knives (baseball bats and knuckle dusters, for example), knives that have no obvious lawful civilian use (such as butterfly knives and bayonets), knives and other articles that have been modified (sharpened screwdrivers, for example), and even (and most unhelpfully for our purposes here) normal domestic knives carried with the intention of causing injury.
As a category of crime ‘offensive weapons’ may make legal sense, but it is at best unhelpful when trying to understanding the relationship between stop and search and particular kinds of weapons. The headline data simply don’t tell us anything about how many were knives and how many were other weapons.
For August 2016, we see that there were 249 arrests for offensive weapons (11.0 per cent of all arrests) including 156 where the search reason was also offensive weapons (62.7 per cent of all offensive weapons arrests) and 59 (23.7 per cent of all offensive weapons arrests) where the search reason was drugs. Looking at the longer 11-month period to August 2016, there were 2,207 offensive weapons arrests (8.3 per cent of all arrests following stops and searches), of which 1,306 (59 per cent of offensive weapons arrests, 4.9 per cent of all arrests) followed a stop and search for offensive weapons, while 593 (26.9 per cent of offensive weapons arrests) followed a stop and search for drugs.
Points and blades and offensive weapons together
Taking points and blades and offensive weapons arrests together, over the 11-month period to August 2016, they constituted 11.6 per cent of all arrests following stops and searches (3,085 arrests out of 26,628), of which 896 (29.0 per cent) followed stops and searches for drugs.
Concluding thoughts
What can we conclude from these data on the relationship between reasons for stops and searches and reasons for arrests? I think four things stand out:
1. There are grounds for thinking that Theresa May was wrong to say that there could be no link between falling numbers of stops and searches for drugs and rising knife crime. First, all else being equal fewer drugs stops and searches will result in fewer knives (and other offensive weapons) being ‘taken off the streets’. Second, to the extent that stops and searches have other positive outcomes even when arrests do not result, including intelligence that may be obtained and also the possibility of deterrence, these will also be reduced.
2. That said, relatively few stops and searches result in arrests for knives or other offensive weapons. In the longer-term data examined here, across London there were only around 80 arrests per month where the main reason for the arrest was points/blades offences, and a further 200 for offensive weapons (which we have seen are not limited to knives) and these resulted from more than 12,000 monthly stops and searches. On average, then, for every 300 stops and searches there were only two arrests for points/blades and five for offensive weapons.
3. This low hit rate suggests two things. First, that knife and offensive weapon carrying may not be very common (or at least perhaps that the police may not be stopping and searching the right people). Second, notwithstanding any deterrent effect, which is not well understood or evidenced, stop and search does not appear to be a very efficient or effective way of ‘taking knives off the streets’. This low success rate has to be weighed against the impact on police legitimacy from the use of stop and search. It may for example impact on the willingness of the public to volunteer information to the police about who is carrying knives and when.
4. Published data should include more specific information, including on knives as a proportion of the wider category of offensive weapons, if the contribution of stop and search to tackling knife crime is to be better understood.
The data presented here are only a small piece of a much bigger picture, but they nevertheless seem to be important to a debate about the relationship between falling stop and search rates and violent and especially knife-related crime. More than anything, this analysis should reinforce the point that we cannot expect the police service to proactively stop and search knife crime away they can only ever be one small part of a much larger task that must necessarily look beyond policing for its solutions.
Data
The data below are recreated from previously or currently published ‘MPS Stop and Search Monitoring Reports’. To view full scale, click image below: