
When the policy to increase (‘uplift’) police officer numbers in England and Wales by 20,000 was first announced last year it was greeted with guarded optimism but also arguments about how to allocate the extra officers to police forces. The main division has been between ‘more of the same’, using the existing funding formula, and ‘levelling up’, allocating more officers to forces that had seen funding and officer numbers cut the most under austerity.
As so often, a number of forces and PCCs argued that they should be given special treatment, most notably the MPS Commissioner Cressida Dick who suggested that the MPS should receive 6,000 extra officers.
The Home Office has now adopted the funding formula to allocate the first 6,000 officers from the uplift, but the analysis below suggests a rethink may be required and moreover that the government must urgently grasp the nettle of funding reform in order to avoid saving up further problems for the future. The question of what a fair distribution of funding looks like is not going away.
The impact of austerity
By March 2019, nine years after austerity began, the 43 territorial police forces in England and Wales had reduced their total number of police officers by 16 per cent (down from 143,734 to 123,170), police staff by 19 per cent (from 79,596 to 64,411) and PCSOs by 42 per cent (from 16,507 to 9,565). Buildings have been closed and sold off, including an estimated 400-600 police stations, and service levels to the public have been cut.
Those national data conceal the fact that austerity has not fallen evenly on the 43 police forces, and indeed they have adopted different strategies to cope with cuts, for example in terms of their workforce mix and reflecting their ability to sell off assets.
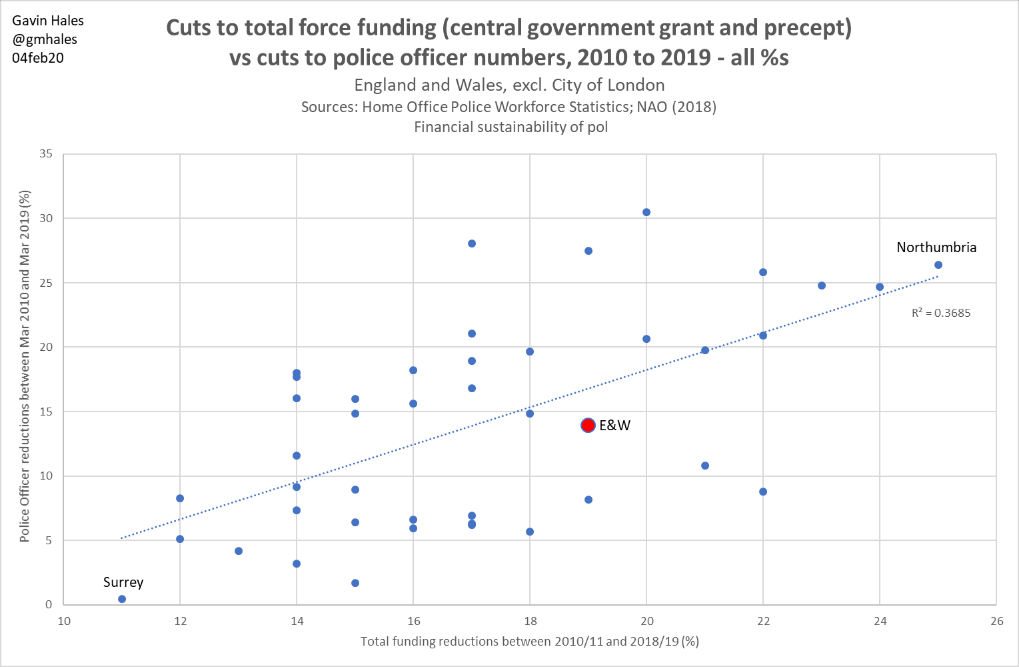
Here, for example, is the relationship between total funding reductions between 2010/11 and 2018/19 and police officer reductions between 2010 and 2019. While cuts to officer numbers have increased with cuts to overall funding, the correlation is not especially strong, suggesting a range of factors have been involved (as we would expect).
*Click on image to expand to full size
Police funding
Police funding broadly consists of a central government grant and local council tax ‘precept’ receipts, with the latter varying widely between forces (see this National Audit Office report for details). In 2010/11, local precept funding accounted for 26 per cent of forces’ funding, while by 2018/19 that had reached 36 per cent through the combined effects of cuts to the central government grant and the progressive relaxation of controls on precept increases.
The central government grant is allocated to forces using a complicated funding formula that was devised in 2006 and considered out of date and ineffective as long ago as 2015, when a revised model was consulted on but ultimately abandoned. The variables used to calculate the funding formula – which effectively decides how big each force’s slice of the overall funding cake will be – are based on data from the early-2000s. [1]
From 2010, cuts to the central government grant (‘damping’) were applied evenly in percentage terms, without reference to the varying funding mix that reflected both historical decisions about precept levels and rises, but also the underlying council tax base in forces. By 2018/19, Northumbria, which had the lowest precept revenues (in percentage terms), had seen overall funding fall by 25 per cent compared to 2010/11, while Surrey, with the highest precept revenues had suffered only an 11 per cent fall. The changes are summarised in this National Audit Office chart [2]:
*Click on image to expand to full-size
full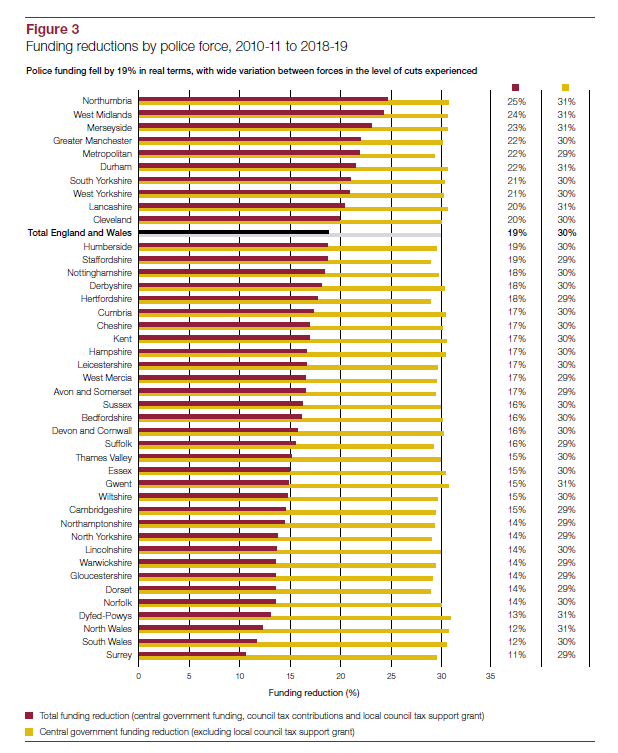
Other sources of funding not included in these figures will include the use of reserves, the sale of assets such as buildings, and income-generating activities, all of which will vary by force.
The uplift
The Home Office has decided to adopt the funding formula to determine how the allocation of the first 6,000 officers from the 3-year 20,000 uplift will take place (see Table 7 here).
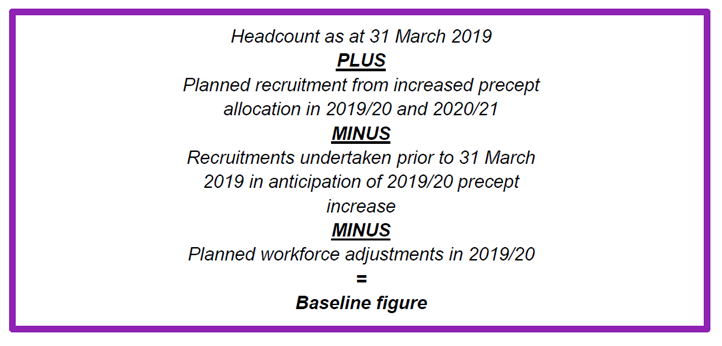
At this stage, the force-by-force baseline for the uplift – the starting point against which increases will be assessed – is still being determined, according to a formula devised by the Home Office that starts from the police workforce statistics as at 31 March 2019 and then takes account of other recruitment and workforce plans that aren’t reliant on uplift funding (below).
The uplift at force level: indicative figures
In order to examine how the uplift might impact on police officer numbers at a force level, I will rely at this stage on the published Home Office 31 March 2019 workforce data and assume that all of the 20,000 officers will be allocated to forces on the basis of the existing funding formula (the numbers are summarised at the end of this blog).
Clearly this analysis will be indicative only.
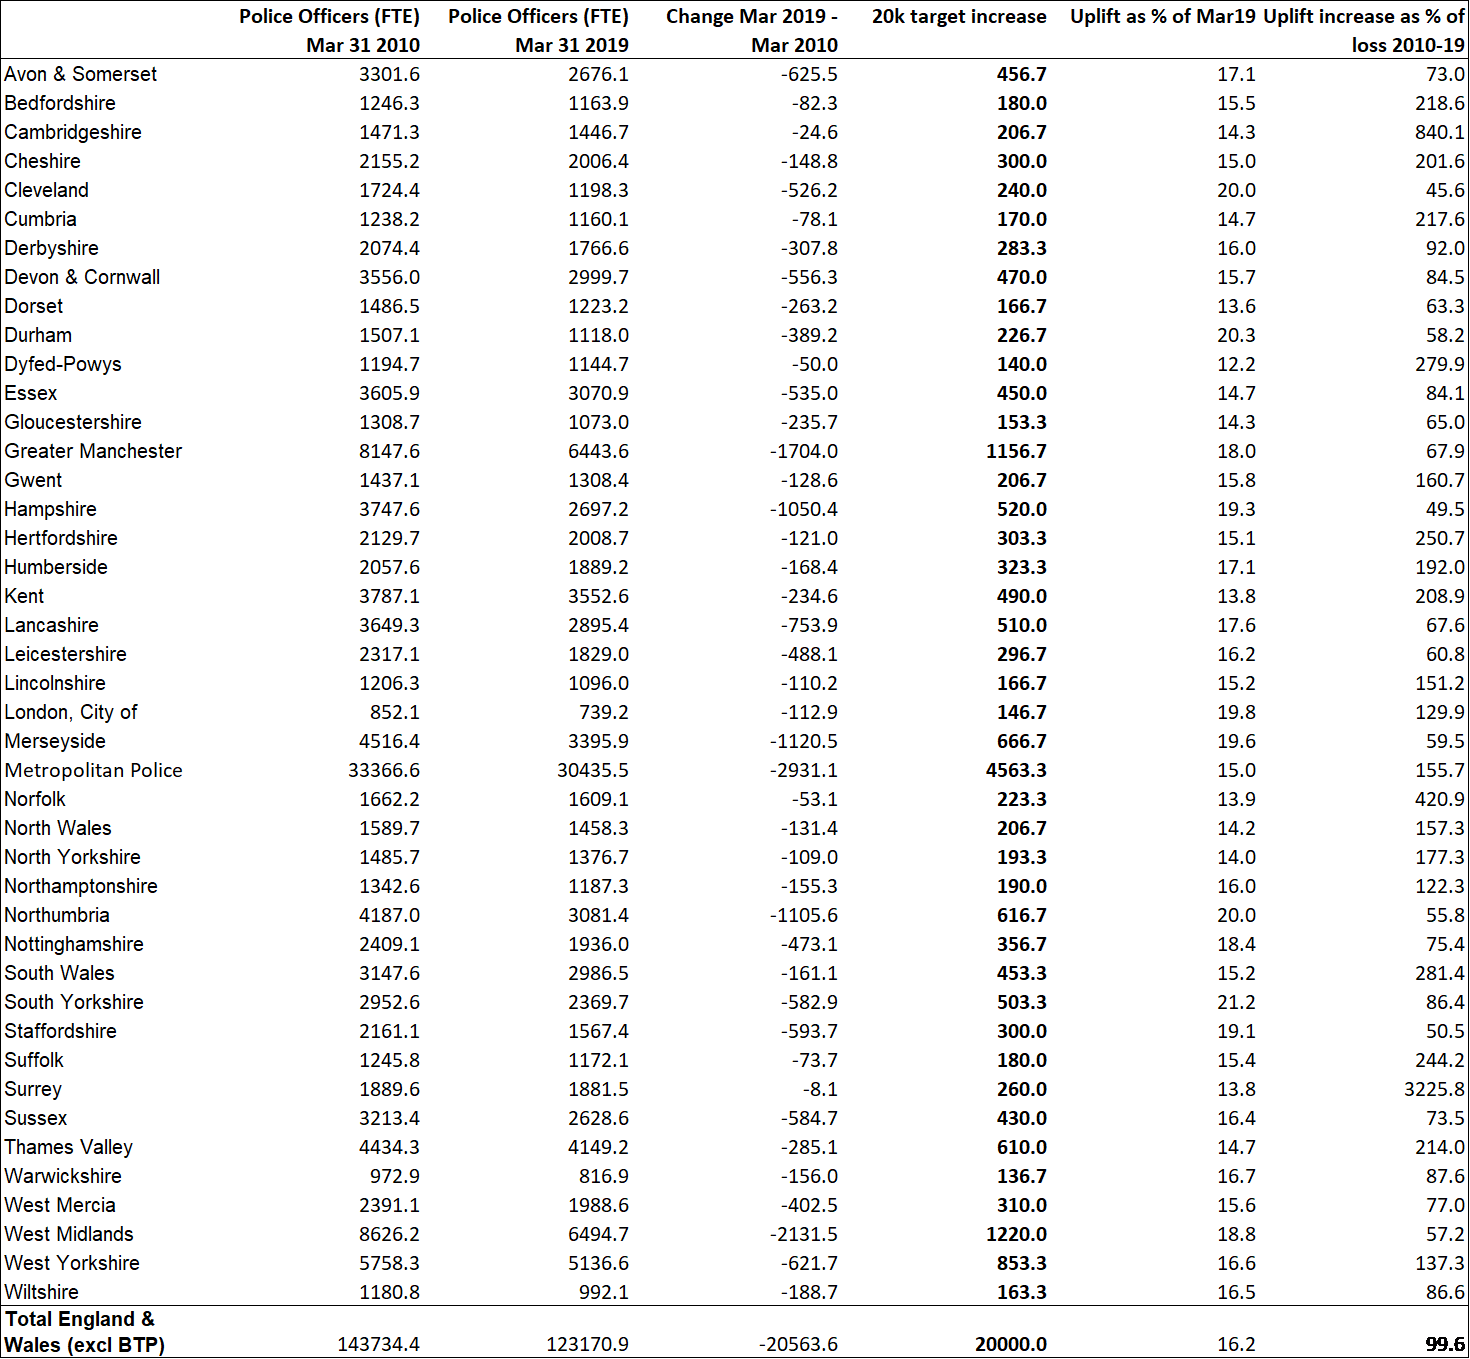
First, we can examine the indicative impact of the 20,000 officers as a percentage of the 31 March 2019 force-level police officer totals (full time equivalent – FTE). Overall, there would be a 16.2 per cent increase on March 2019 across the 43 territorial forces in England and Wales, but this would vary from a 12.2 per cent increase in Dyfed-Powys, to a 21.2 per cent increase in South Yorkshire. To reiterate, these figures exclude other recruitment plans funded by precept rises.
*Click on image to expand to full-size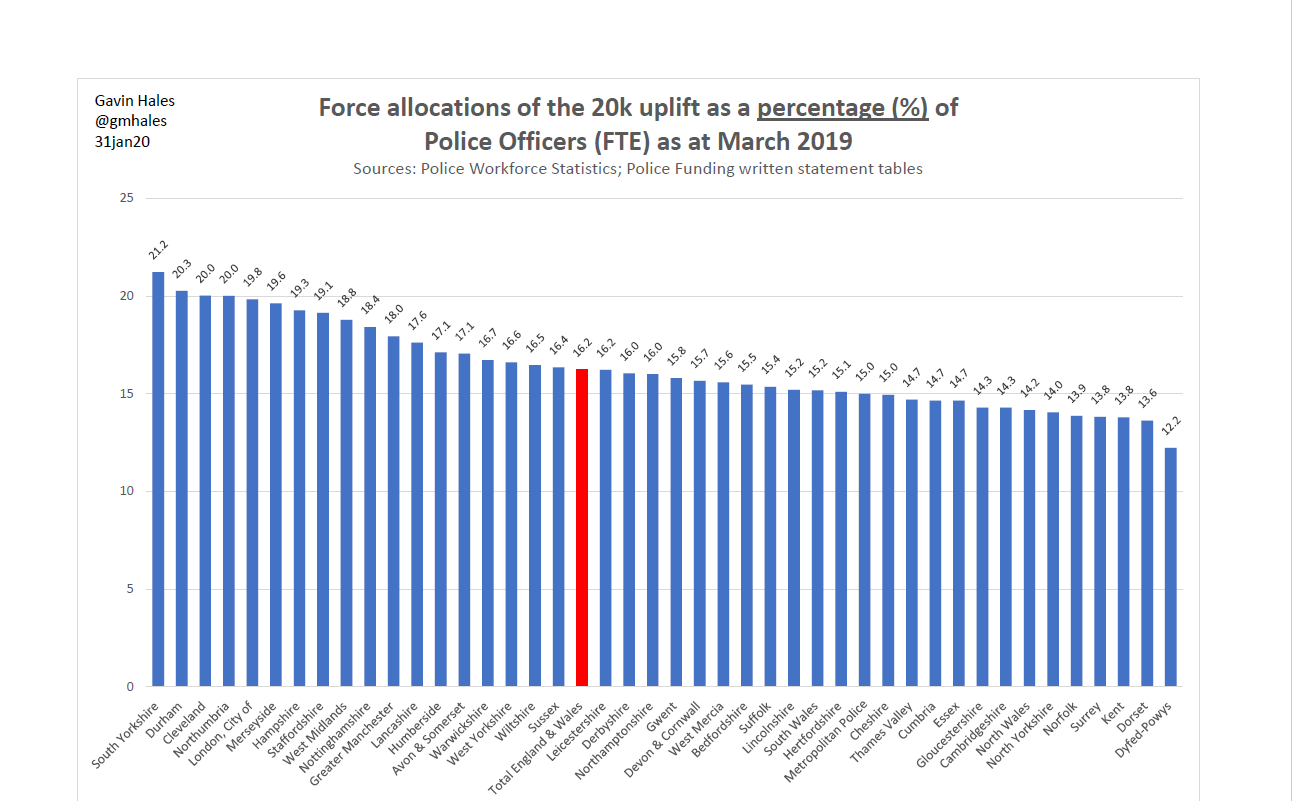
Next, we can examine how the indicative uplift relates to changes to police officer numbers since the advent of austerity in 2010, again using the published Home Office police workforce statistics. Overall, 21 forces would make a net gain on their position in March 2010 and 22 would continue with a net loss – but the detail is hard to read due to the impact of the Metropolitan, West Midlands and Greater Manchester Police forces.
*Click on image to expand to full-size
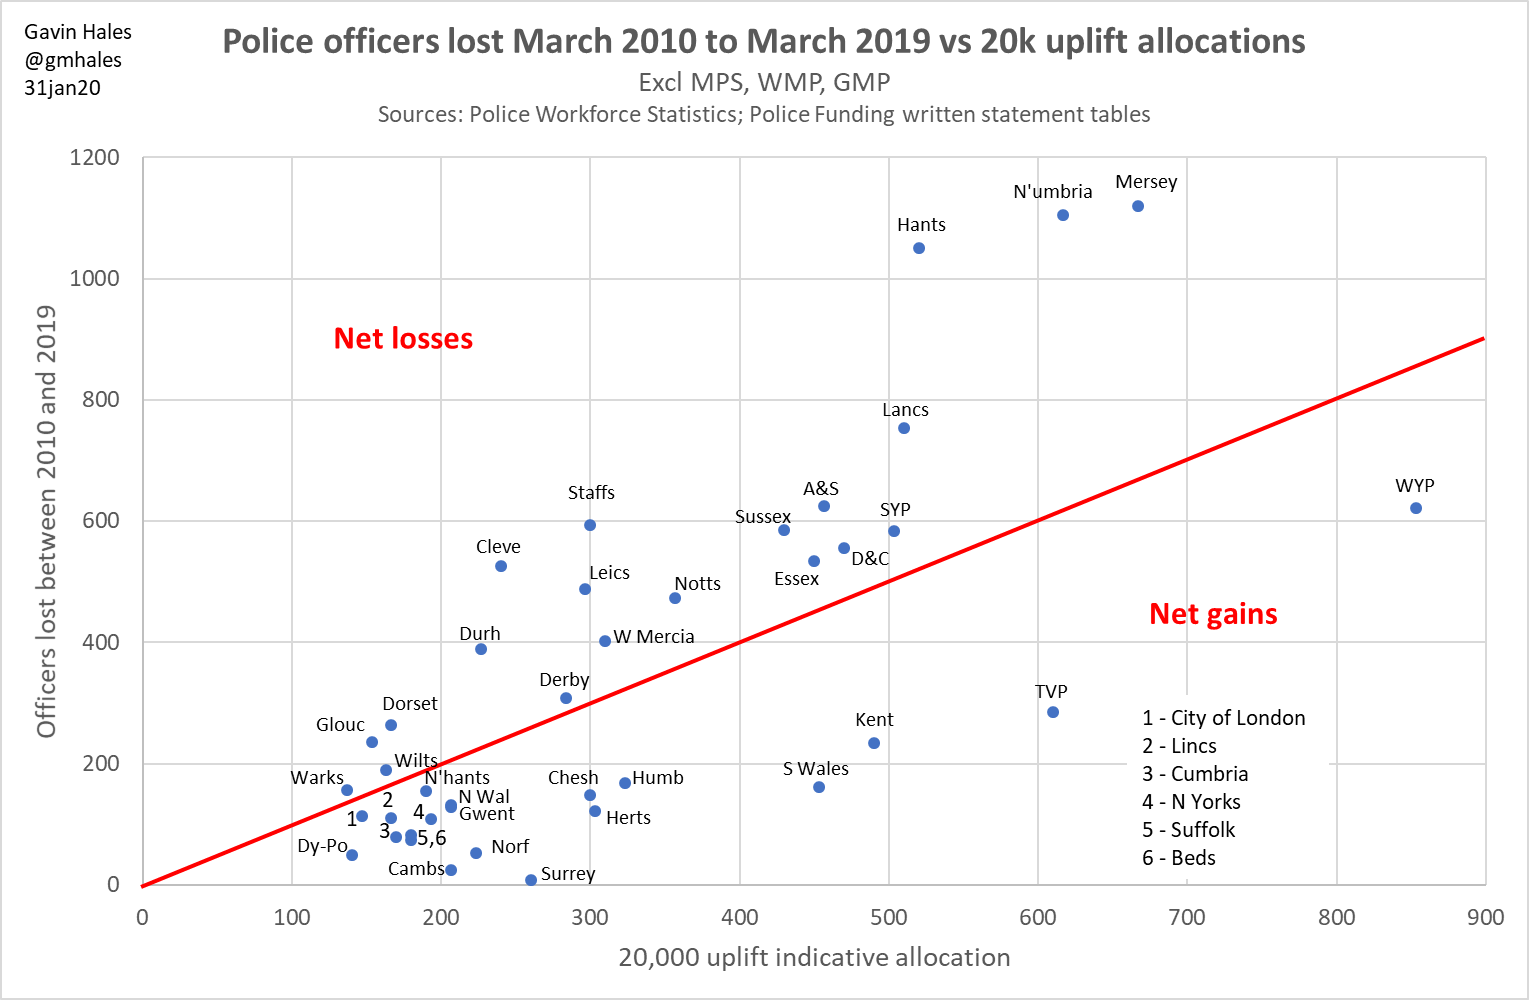
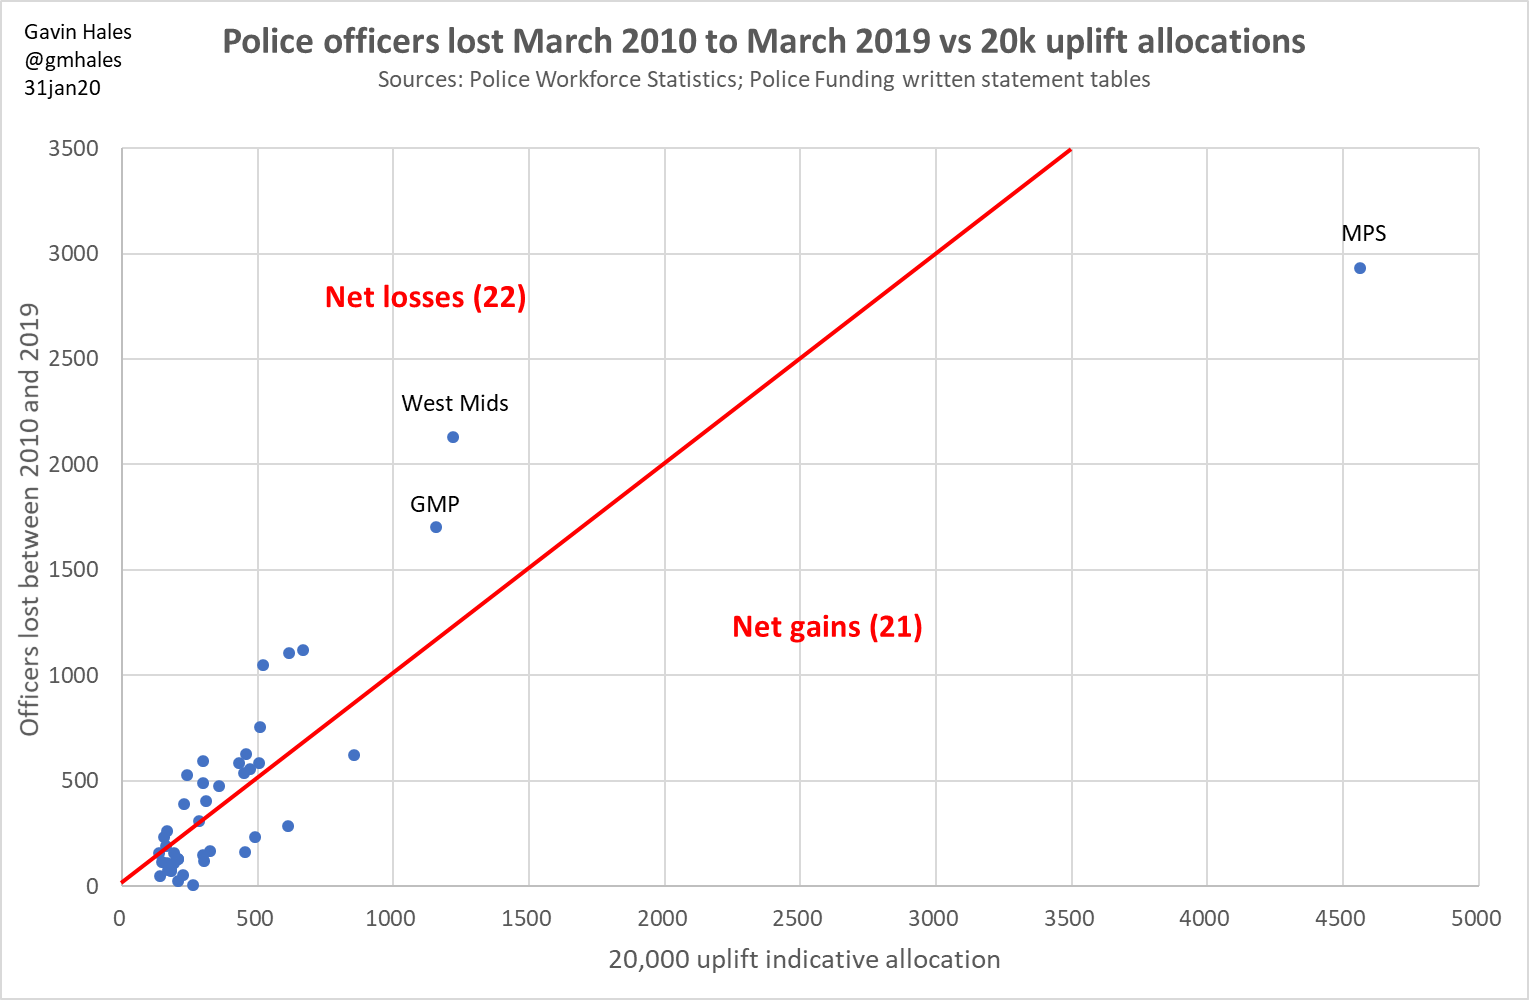 Removing those three large forces, it is possible to see the detail. Northumbria has lost 1,106 officers but would gain only 617, while Surrey has lost only 8 officers and would gain 260.
*Click on image to expand to full-size
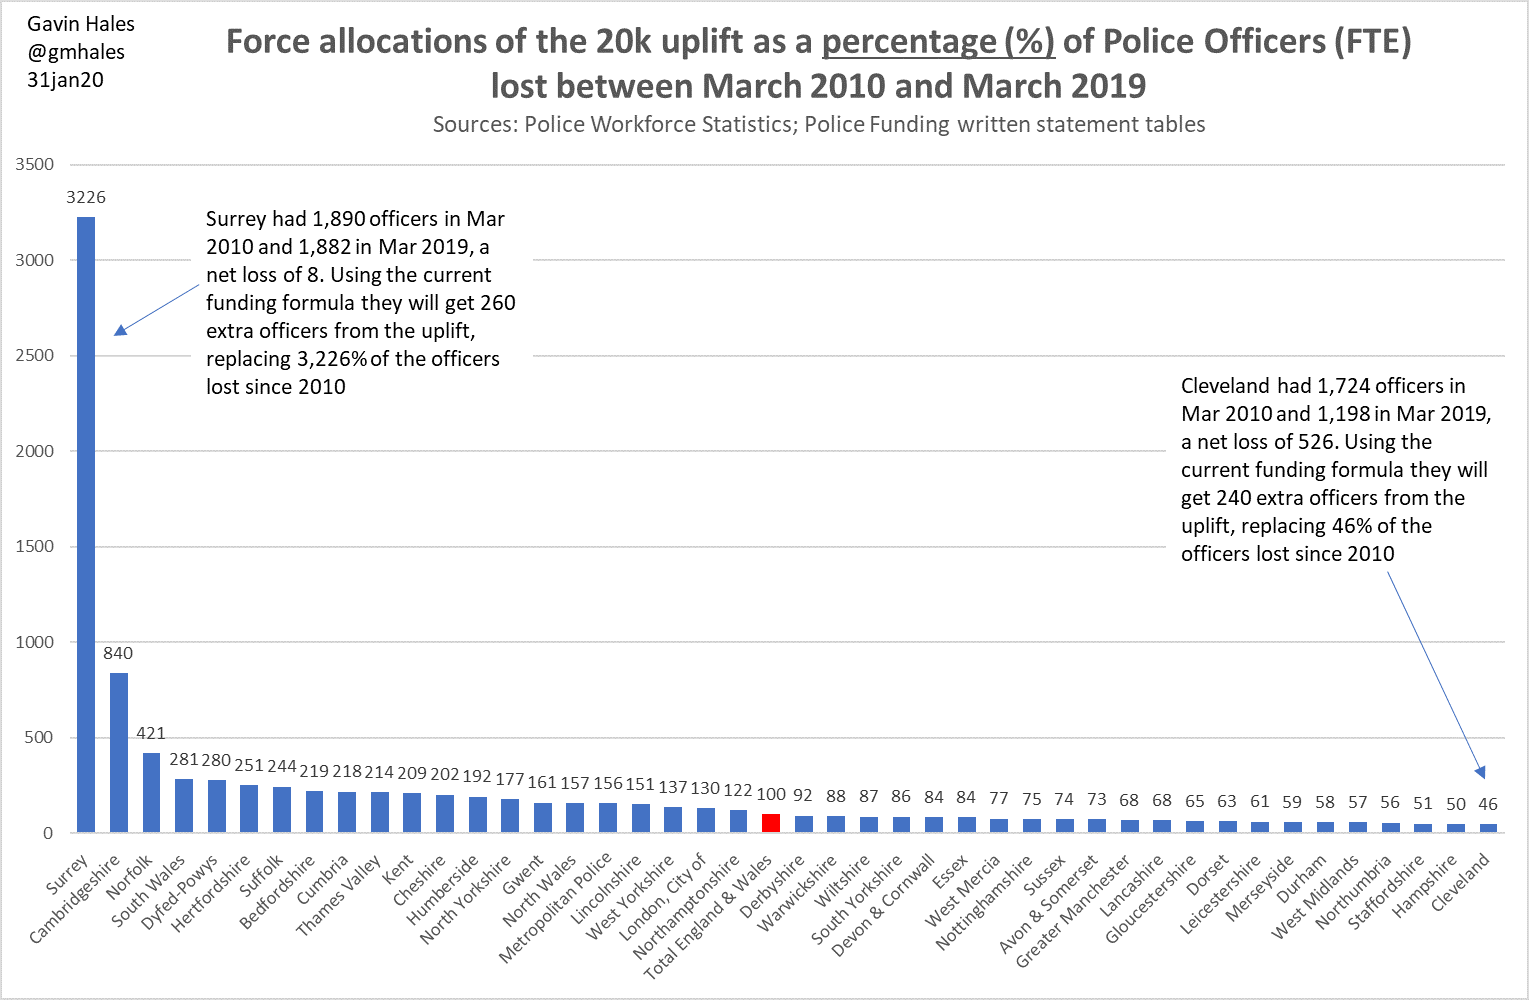
Finally, for a different view of the data, we can examine the indicative allocations from the 20,000 uplift as a percentage of the officers lost between 2010 and 2019. Here 100 per cent would indicate that all officers lost would be replaced, less than 100 per cent would indicate a net loss and more than 100 per cent a net gain. As above, taking a long-term view, the 20,000 uplift will, if based on the current funding formula, produce winners and losers.
*Click on image to expand to full-size
Discussion: a question of fairness
The uplift represents a huge and welcome injection of resources into policing in England and Wales – albeit one that arguably ignores the need for a balanced workforce – but more clearly than ever shines a light on the basic question of how to allocate resources fairly and in the broad public interest. These are not easy questions to answer.
The impact of austerity has varied greatly across the 43 police forces in England and Wales. These differences have arisen at the intersection of the varying police funding mix between central government and local council tax revenues, the flat-rate application of cuts (‘damping’) to the central government grant from 2010, the different strategic workforce decisions taken by forces in the face of cuts, and other factors such as the potential for selling assets that have meant some forces have been more resilient than others.
The effect of these differential impacts has been a growing inequality between forces, and we can assume in the service they are able to offer the public. Contrast, for example, the near 31 per cent fall in police officer numbers in Cleveland, with the 0.4 per cent fall in Surrey (comparisons of wider workforce changes are complicated by the fact Cleveland has outsourced many police staff roles, starting in 2010).
The evidence above suggests that adopting the funding formula to allocate the 20,000 uplift to forces leaves this inequality largely intact, with some forces in a strongly net positive position relative to March 2010, and others still well behind.
It has long been accepted that the funding formula is out of date and not a reliable indicator of relative workload and other costs. For example, it relies on data from the 2001 Census, but between 2007 and 2016, London’s population grew 14.2 per cent against an average of 7.3 per cent for England and Wales, while Cumbria’s fell 0.6 per cent and the populations of Dyfed-Powys and Cleveland grew by less than 2 per cent. [3] Crime rates measured by police recorded crime have changed greatly since those used in the funding formula, and these changes will not have fallen evenly across the country. Between 2003/4 and 2018/19, for example, the total police recorded crime rate fell 32 per cent in the MPS (from 144 to 97.3 per 1,000 population) but only 8 per cent in Cumbria (from 81 to 74.4 per 1,000). [4]
A revised funding model will be technically challenging and politically uncomfortable for government, Police and Crime Commissioners and the police service, because like the approach adopted to austerity it too will involve winners and losers and special pleading on all sides; I was told at the time of the ill-fated 2015 revised funding formula that at the extremes some forces would have gained or lost 20 per cent had it been introduced. The growing significance of the precept, and the wide differences between forces in its importance, are considerable complications and we must be alert to the possibility that we are sleepwalking towards a world in which police resources are allocated not on the basis of need but wealth.
In the case of the uplift, these challenges are being ducked again, while the funding formula sits in the long grass where it was dropped. Failing to grasp the nettle of fair funding and resourcing today risks both compounding previous decisions that drove inequality under austerity but also saving up even greater problems for the future.
Summary data applying the current funding formula to calculate indicative allocations of police officers to forces under the 20,000 uplift [5]
*Click on image to expand to full-size
[1] For details, see https://assets.publishing.service.gov.uk/government/uploads/system/uploads/attachment_data/file/447083/2015_07_20_Police_funding_consultation_doc.pdf
[2] Figure 3 in NAO (2018) Financial Sustainability of police forces in England and Wales https://publications.parliament.uk/pa/cm201719/cmselect/cmpubacc/1513/1513.pdf
[3] Source: ONS police force mid-year population estimates (see https://twitter.com/gmhales/status/923456091098435584?s=20).
[4] Sources: Dodd et al. (2004) Crime in England and Wales 2003/2004. Home Office Statistical Bulletin 10/04; ONS (2019) Crime in England and Wales: Police Force Area Data Tables, year ending March 2019 https://www.ons.gov.uk/file?uri=%2fpeoplepopulationandcommunity%2fcrimeandjustice%2fdatasets%2fpoliceforceareadatatables%2fyearendingmarch2019/policeforceareatablesyeendingmarch2019.xlsx.
[5] Sources: Home Office Police Workforce, England and Wales, 31 March 2019: open data tables https://assets.publishing.service.gov.uk/government/uploads/system/uploads/attachment_data/file/817734/open-data-table-police-workforce.ods; Police Funding 2020/21:Written statement – HCWS51 https://www.parliament.uk/business/publications/written-questions-answers-statements/written-statement/Commons/2020-01-22/HCWS51/. The allocations indicated in the latter for the first 6,000 officer uplift have been used to calculate the allocations of the full 20,000.